
The following guide will cover the steps required to get MinIO Monitoring working with Prometheus to extend the amount of reporting data for your instance.
This guide assumes that MinIO is deployed via Docker, and we will use docker to deploy new Prometheus instances per MinIO site. For information on setting MinIO up initially see my previous MinIO guides.
For this guide we will be using token (called Bearer Token) based authentication to the MinIO reporting. The process can be drastically simplified by making monitoring data publicly available, but that won’t be covered in detail here. As per previous guides, I will also look to minimise (avoid) use of the root user, with a dedicated monitoring user and permissions to be configured.
If you have multiple MinIO instances, also note where steps only need to occur once versus where configuration needs to be applied per instance.
Create a Prometheus User
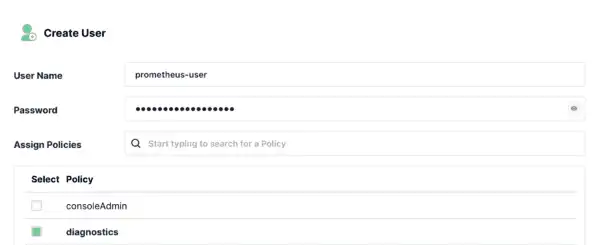
Start by creating a new user. This account will be used to generate the Bearer Token that will be used to query the monitoring data. It is possible to generate a Bearer Token using the root account, and many guides will use this, but then the token will not work if you disable the Root users account, which if you have followed my previous guide, should be the case currently. Instead a dedicated account with reduced permissions will be used.
In the MinIO web UI navigate to the users page (Identity -> Users) and create a new user. Give it a name. Assign the policy Diagnostics initially. Later we will reduce these permissions.
Generate Bearer Token
To generate the Bearer Token, a tool called MC will be used. This is a MinIO Client tool that allows interacting with MinIO via a command line. There’s a few ways to get this, but for simplicity we will download the standalone binary.
Navigate to a folder for the binary and execute:
wget https://dl.min.io/client/mc/release/linux-amd64/mc
chmod +x mc
./mc --help
Most commands executed by MC will need an alias to be set. This is the destination MinIO instances and a credential to use for the connection. To create a new Alias, run the following.
mc alias set {alias name} https://{minio-path:port} {prometheus username} {prometheus user password} For example
mc alias set minio-01 https://minio.mysite.com:443 prometheus-user prom-password-1234Now generate the Bearer Token that will be used when configuring Prometheus.
mc admin prometheus generate minio-01 'cluster'Replace ‘minio-01’ with the alias you selected.
Note the output, which will be needed shortly. The one Token can be used against all MinIO instances so there is no need to repeat this for multiple replicated instances.
If you have multiple servers, you can generate multiple Alias from a single MC instance. You do not need the tool on each server.
Setup Prometheus
For this guide Prometheus will be setup to run via Docker-Compose alongside the MinIO container. I have not created a central Prometheus instance, nor will I expose Prometheus externally from my VPS. This should be possible if you’d like to do so however.
Firstly, open the Docker-Compose file that is running MinIO and add the following service configuration.
  prometheus:
    image: prom/prometheus
    command: --config.file=/etc/prometheus/prometheus.yml
    ports:
      - "9090:9090"
    volumes:
      - ./prometheus.yml:/etc/prometheus/prometheus.yml
Add the following to your existing MinIO services environment variables:
      - MINIO_PROMETHEUS_JOB_ID=minio-job-01
      - MINIO_PROMETHEUS_URL=http://prometheus:9090
If you used my previous guides, the full file will look something like this.
version: "3.7"

services:
  minio:
    image: quay.io/minio/minio
    command: server --console-address ":9001" /mnt/data
    restart: unless-stopped
    environment:
      - MINIO_ROOT_USER={Replace-Me}
      - MINIO_ROOT_PASSWORD={Replace-Me}
      - MINIO_PROMETHEUS_JOB_ID=minio-job-01
      - MINIO_PROMETHEUS_URL=http://prometheus:9090
    volumes:
      - type: bind
        source: /data/minio
        target: /mnt/data
    ports:
      - 9000:9000
      - 9001:9001

  prometheus:
    image: prom/prometheus
    command: --config.file=/etc/prometheus/prometheus.yml
    ports:
      - "9090:9090"
    volumes:
      - ./prometheus.yml:/etc/prometheus/prometheus.yml

volumes:
  minio_data:
Because both MinIO and Prometheus are in the same Docker Compose file, the two services can communicate over the internal Docker network. This allows MinIO to reference Prometheus using the container name (thus http://prometheus:9000 will resolve).
Create a new file prometheus.yml alongside the docker-compose.yml file with the following contents:
global:
    scrape_interval: 15s
    evaluation_interval: 300s

scrape_configs:
  - job_name: minio-job-01
    bearer_token: {Replace-Me}
    metrics_path: /minio/v2/metrics/cluster
    scheme: https
    static_configs:
    - targets: ['minio.mysite.com:443']
Replace the bearer_token with the output of your earlier token generation command. Replace ‘minio.mysite.com’ with the public address of your MinIO instance.
Before we enable the services, a note on the job_name. As I am running multiple MinIO instances, I have opted to explicitly include the job name in my docker-compose.yml file. If you were to instead call the job ‘minio-job’ (instead of ‘minion-job-01’), then you can omit the variable MINIO_PROMETHEUS_JOB_ID from your docker-compose file as ‘minio-job’ is the assumed default. Personally, I feel like the verboseness of specifying the name is useful should I ever rename the job in the prometheus config file, as I’ll be more inclined to realise why the MinIO instance is no longer working when the job names don’t match.
With multiple MinIO instances I have named the job on each sequentially 01, 02, etc. You can use any naming convention you like, and the names can be the same on each server since we have a prometheus instance per server.
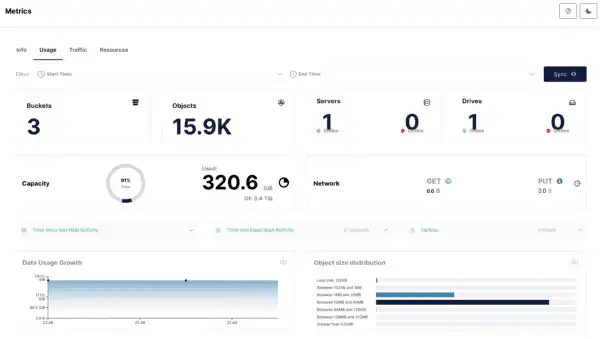
Once the configuration is in place, down all docker compose services and then start them back up. If there are no errors, you should be able to navigate to the Monitoring section in the MinIO console and see that the tabs ‘Usage’, ‘Traffic’, ‘Resources’ are now available to access and will gradually populate with data.
As a note, if you were comfortable with exposing your MinIO monitoring data, you could add the environment variable “MINIO_PROMETHEUS_AUTH_TYPE=public” to your docker-compose file, and then skip the previous steps of generating a Bearer Token. Your prometheus.yml file would also omit the token configuration and you wouldn’t need to create the user account either. Personally, I believe generating the token as a once off is worth the extra effort.
Troubleshooting
If you are not getting monitoring data, a few things to look out for are:
- If the MinIO Console reports that the Prometheus service cannot be contacted, confirm that the Prometheus container has started and that the address supplied to MinIO is valid. If you are not using the same docker-compose.yml file as MinIO, or are using a standalone or external Prometheus instance, you may also need to configure additional network rules.
- If you do not see any errors (e.g. Prometheus is being connected to), however there is seemingly no advanced monitoring data appearing in MinIO, double check that the Prometheus Job Name in the prometheus.yml file matches that in the MinIO configuration in docker-compose.yml. If the names do not match, then you may not see any errors on the UI but no data will appear. As above, I recommend specifying the job name explicitly.
- Ensure the MinIO Prometheus user account is enabled and has appropriate permissions set.
Minimise Prometheus User Permissions
With the above working, one last thing that can be done is to minimise the permissions used by the Prometheus user account. The Diagnostic policy includes a number of privileges that are not needed for accessing prometheus data. By default the following is enabled for that policy.
{
    "Version": "2012-10-17",
    "Statement": [
        {
            "Effect": "Allow",
            "Action": [
                "admin:ConsoleLog",
                "admin:OBDInfo",
                "admin:Profiling",
                "admin:Prometheus",
                "admin:ServerInfo",
                "admin:ServerTrace",
                "admin:TopLocksInfo",
                "admin:BandwidthMonitor"
            ],
            "Resource": [
                "arn:aws:s3:::*"
            ]
        }
    ]
}
To apply reduced permissions to your account, in the MinIO Console go to the Policies page and click New. Create a new Policy, such as ‘Prometheus’, and then apply the following Raw Policy
{
    "Version": "2012-10-17",
    "Statement": [
        {
            "Effect": "Allow",
            "Action": [
                "admin:Prometheus"
            ],
            "Resource": [
                "arn:aws:s3:::*"
            ]
        }
    ]
}
Save the changes. This new policy includes only the Prometheus permissions from the longer list that the Diagnostic policy supplies.
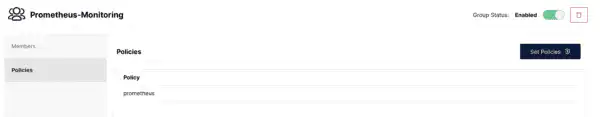
To apply the Policy to the user, I created a new group and added my Prometheus user to it. I then set the policy to my newly created Prometheus policy. Lastly, open the Prometheus user and remove the Diagnostics policy that’s currently directly assigned to the user.
Save all changes and then visit the monitoring page to confirm that monitoring data is still being retrieved.
If you have multiple MinIO instances, then this user accounts configuration will replicate across servers and therefore this step does not need to be repeated.
Closing
With the above in place, you should get additional advanced statistics via the MinIO interface.
If you would like you can optionally configure Grafana to access Prometheus to run your own reports. I have no plans to do so myself, but if this interests you then check out this example project. If I was to explore this, I feel that this is the point where I’d want to centralise both Prometheus and Grafana on single instances where data across multiple MinIO sites could be pooled, alongside any other service one may have.